Measuring PPC Results
7.1 Analyzing Your PPC Performance
Using analytics properly is one of the most crucial parts of your campaign’s performance. If you don’t track your results and adjust your campaigns based on data, you’re going to waste so much money it’s not even funny. It’s a lot to talk about here (we could write a whole book explaining how to measure things) so we’ll try to be short and to the point.
To make sure you analyze your data correctly, there are a few tools you should use that will help with your data-driven decisions. But the main one to start with is Google Analytics.
Google Analytics is a web analytics tool created by Google that allows you to track your website traffic. It’s the most commonly used web analytics tool out there, and you can use it for free. Analytics is a very important tool, but underused by the majority of businesses.
It allows you to:
- See your website traffic in real time (Reports > Real Time)
- See more details about your audience. See things like: demographics, interests, geo location, the device and browser they use and more (Reports > Audience)
- You can also track user engagement, which gives you a grasp of the quality of the traffic you’re getting. (Reports > Audience)
- Analyze your Google Ads performance per campaign, search queries, destination URLs and more. (Reports > Acquisition > Google Ads)
- You can also link your search console to Analytics and see data about your organic traffic. (Reports > Acquisition > Search Console)
- Analyze user behavior on your website. Here you can see info about site speed, see searches that happened on the website, see all the events you are tracking and the performance for each of your pages. (Reports > Behaviour)
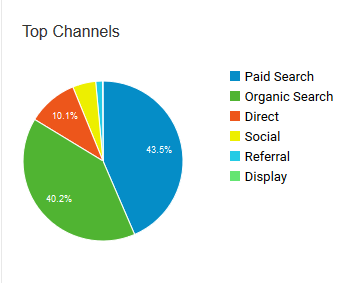
- See which channels are sending you traffic. (Reports > Acquisition)
- You can create your own, customized reports and create something that shows only the data you need. (Customisation > Custom Reports)
- And last, but not least, you can see all of your conversion data. If you have an ecommerce website, you can see which products sold, order value and other info about user shopping behaviour. (Reports > Conversions > E-commerce > Shopping Behaviour)
Traffic from Social Media, Bing Ads or Email campaigns:
If you are advertising via social media, email marketing or any other channels where you want to track your campaign separately from organic (unpaid) traffic, make sure you add UTM tracking. UTM tracking is a code added at the end of links that give Analytics more information about your campaigns. You can use the URL Builder to create it. The final URL you’ll use in your campaign will look something like this: https://www.anyasorganic.com/?utm_source=facebook&utm_medium=cpc&utm_campaign=organic_juice_promo.
It will tell Analytics that the traffic is coming from a Facebook campaign (utm_source=facebook), it’s from a paid campaign (utm_medium=cpc) and your campaign is about a special promotion you have for organic juice (utm_campaign=organic_juice_promo).
To see this data in Analytics go to Reports > Acquisition > All Traffic > Source/Medium. Or if you want to compare the performance between campaigns just go to Reports > Acquisition > Campaigns > All Campaigns.
For Bing Ads, you can automate this process. Just make sure you enable Destination URLauto-tagging.
A few other tools you should consider:
- Hotjar – an analytics tool that allows you to record visitors on your website, create heatmaps and more. It allows you to see first hand what the user is doing on the website, see if they have any struggles finding the info they need, and see how they scroll, click and spend their time.
- Google Optimize – will help you test your website. You can send half of your users to see one variation of your page, and the other half a different one (also known as A/B testing) and see which one has a better performance and higher conversion rate.
- Google Ads – don’t forget that Google Ads has a very good Reports section that allows you to create custom reports and analyse data.
- Google Data Studio – allows you to turn your data into nice-looking reports and dashboards that are easy to read, share and customize.
The internet is full of different tools you can use for your analytics, but the ones above should be your first choice when you are just starting.
7.2 Conversion Tracking
You cannot make data-driven decisions if you cannot associate a conversion (sale, lead, sign-up etc) with a specific channel or campaign.
There are 3 main ways in Google Analytics that help you do this.
- Goal tracking. If you have a confirmation page that the user lands on after he submits (also known as a “thank-you” page) you can set up a destination goal and track all the users that have gotten to it.
- Event tracking. If you care about form submits, or any other type of button clicks that don’t redirect to a thank-you page, you need to set up event tracking. It will allow you to track specific button clicks, video plays and more.
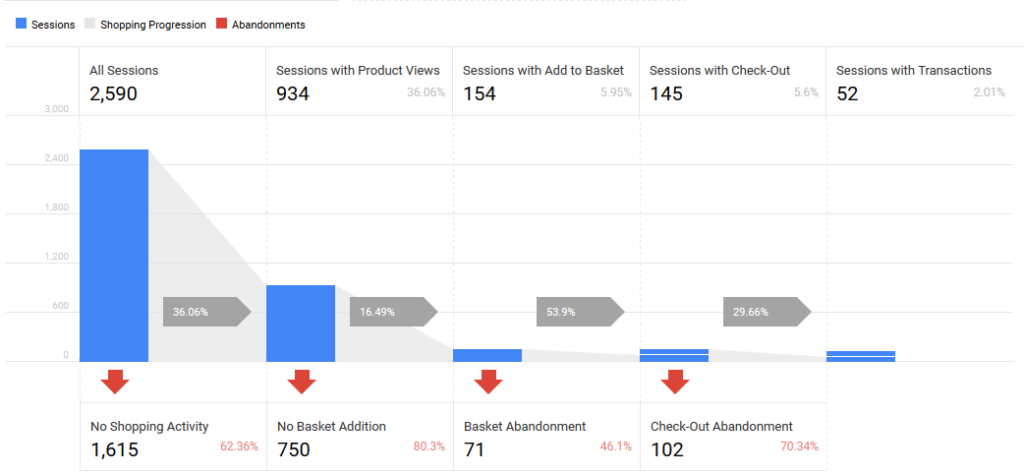
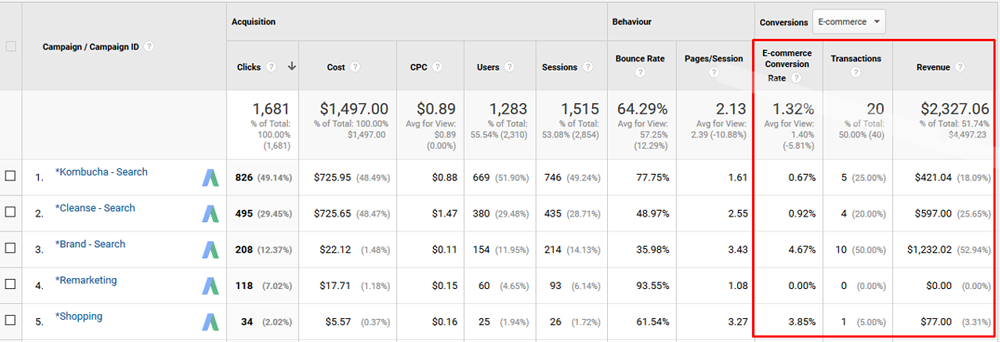
- Ecommerce Tracking. If you are an ecommerce website, you might want to track all orders and have the order value shown to you. The implementation requires more code, but the results will be amazing. You’ll be able to see analytics data in this format:
7.3 What Metrics Do You Measure With PPC?
Once you have Google Analytics set up and your conversion tracking is working, it’s time to see how your campaigns are performing. But what should you actually look at to understand if it works?
User engagement & behaviour
It’s hard to have predetermined numbers which you need to see in your website engagement, as it’s unique to your niche and type of content.
Analytics does a good job showing you some Benchmarking based on your type of business. You can see them in Reports > Audience > Benchmarking. It will look something like this:
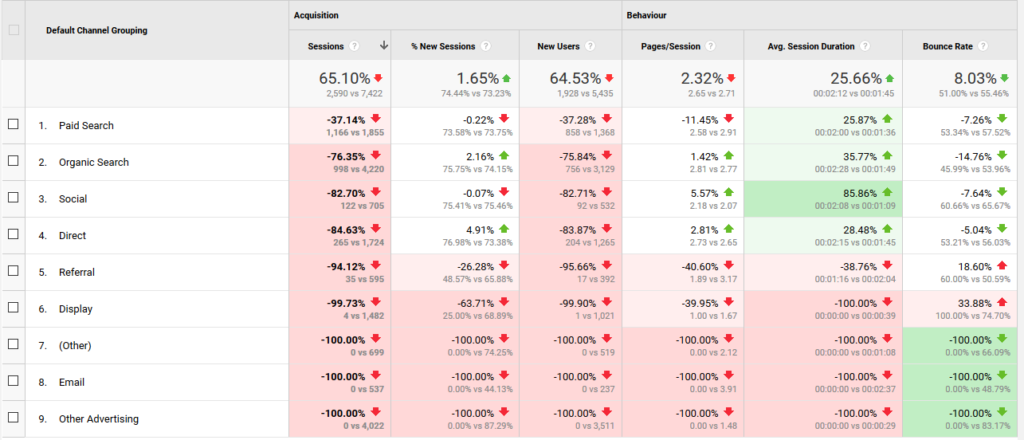
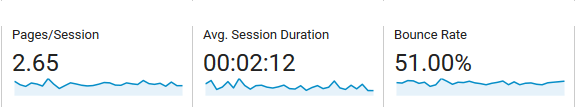
The main metrics to look at would be: time on page (how long visitors stay on your website), bounce rate (the percentage of single-page sessions in which there was no interaction on the page) and pages/session (average time of pages viewed during a session).
Look at it from a common sense point of view. You want average session duration to be at least a minute and you want to have a very low bounce rate.
Compare the results between the channels. If your organic traffic has a higher engagement rate, check the search queries. Maybe it’s because all organic traffic is coming from brand searches? Analyze the engagement between your pages. Maybe it’s one page that brings the average down. See what can be fixed – or maybe that page is not highly targeted to your campaigns? A/B test and see if it makes a difference.
If your average time on page is 10 seconds, and your bounce rate is over 90%, something is not working well. Maybe it’s not the page, but the traffic you send to it. Check your targeting within your campaign and analyze your search terms. Is the audience you’re targeting right for your service? With a poorly set up campaign this happens often!
Conversion rates and transaction value
Great engagement is always a good sign. But is it directly correlated with your sales? Great engagement doesn’t always mean good return on investment.
Analytics gives you data on how much you’ve spent and how much you’ve gotten back. If you’re tracking events and goals you need to know how much each of them is worth to you…and do the math from there. If you have ecommerce tracking, Analytics will tell you how much money you’ve made.
A good conversion rate can be anywhere between 1% (for high value products) and 7-10% (for smaller sales, form submissions or calls).
Same as with engagement, check your conversion rate between campaigns and channels. Don’t just look at the averages. See which campaigns give you the highest revenue, which landing pages perform better and keep testing if you see lower performance for some of them.

ROI, ROAS and Cost Data
After that, we need to calculate your Return On Investment (ROI), the formula is this:
ROI = Total Revenue - Total Cost / Total CostOr, you can use our ROI Calculator to do it for you.
So if you spent $1,000 on your campaigns in one month, generated a revenue of $5,000, with an overhead cost of $2.000, then your return would be (5000 – (1000 + 2000)/(1000+2000) *100%= 2000/3000*100% = 66.67%. This means that for every $1 of total cost, you get $1.66 in profit.
If you want to calculate just your Return On Advertising Spending (ROAS) without overhead cost the formula is:
ROAS = Total Revenue from Ads / Total Ad CostSo if you spent $1,000 on your campaigns in one month, generated a revenue of $5,000, then your return would be $5000/$1000 *100%= 500%. That means that for every $1 spend on ads, you get $5!
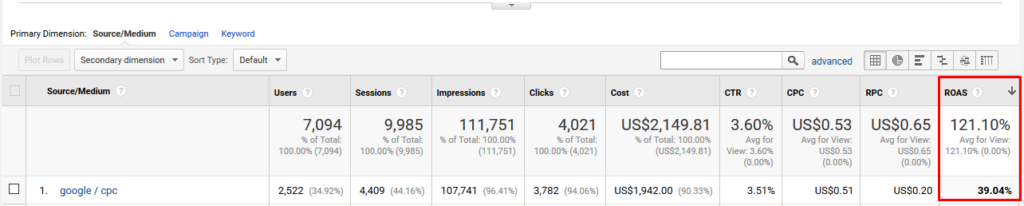
Analytics already calculates ROAS for you. As you have Google Ads data automatically imported you can go to: Reports > Acquisition > Campaigns > Cost Analysis and see this:
If you want to see other channel’s cost data in Analytics, like Bing or Facebook, you’ll have to import your costs. You can find how to do that here.
7.4 Attribution Models
If you’re using multiple channels to advertise, once you have conversion tracking setup, you want to make sure that you understand your user’s journey before they become a lead or make an order. You can learn so much from it!
To do this, in Analytics, go to the left column, go to Conversions > Multi-Channel Funnels > Top Conversions Paths. As “Primary Dimension” choose “Source/Medium Path” and you’ll see something like this:
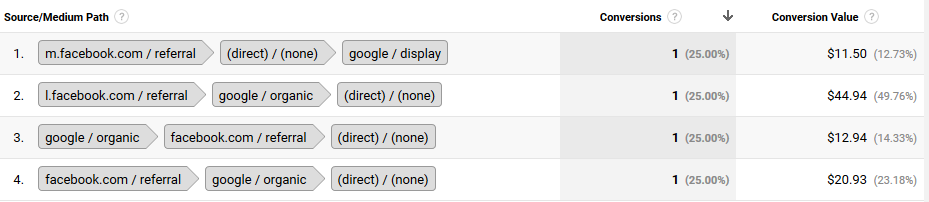
TIP: If one of your payment methods is PayPal, you’ll be seeing that sales are coming from paypal/referral, and you might not know which channel to attribute it to. The report above is the only way to see which channel users used before they went to PayPal.
You can also see this data in Google Ads. It shows you results based on different attribution models (for Google Ads traffic only). Use this report to compare 2 different attribution models side-by-side. It’s more advanced analytics, but I’m sure you can figure it out!
Once you’re here, go to Attribution Modeling. There are five ways you can look at your data:
- Last Click – gives all credit for the conversion to the last-clicked ad and corresponding keyword.
- First Click – gives all credit for the conversion to the first-clicked ad and corresponding keyword.
- Linear – distributes the credit for the conversion equally across all clicks on the path.
- Time Decay – gives more credit to clicks that happened closer in time to the conversion. Credit is distributed using a 7-day half-life.
- Position-based – gives 40% of credit to both the first- and last-clicked ads and corresponding keyword, with the remaining 20% spread out across the other clicks on the path.
You can find more about it here.
7.5 Testing for PPC
At this point, you should be able to set up a successful campaign and be able to analyze and optimize it to get the most out of it. Congrats!
The purpose of this short section is to remind you to never stop testing. That’s the only way to be successful.
- Test your keywords to see which give you the most targeted user traffic
- Test your landing pages to see which are more relevant to the user’s search
- Test your ads to see which message gets a higher CTR (click-through-rate) and a better Quality Score
- Test your messaging, wording, colors and offers.
Keep analyzing:
- Search terms used to get to your website
- Channels that bring you traffic
- User engagement based on the channels and campaigns
- Conversion rates and ROI to see how profitable your campaign is
Anddd….that’s it for now! Please let us know if there is any info we’ve missed or anything else you’d like to learn about. Use our contact page or the chat on this page to give us your feedback and let us know how useful it was! We care about your experience.
Kind regards,
Anya & Gil!