
What’s the main complaint Google Ads professionals have about recent changes on the platform?
Losing access to search terms, along with other granular insights. We used these tools for analyzing competition, market research, tracking trends, and exploring behavior by discovering which terminology and syntax is used by customers.
With PMax, Demand Gen, and the various roll-up of automations within search and shopping campaigns, many PPC folks feel like this important data has been stolen from us.
But what if it wasn’t stolen, but more like “moved somewhere else”?
As it turns out (and as we’ll describe in this article) we are just doing research in the wrong place now. More data is visible, incorporating the analysis of both paid and organic at the same time. It’s still limited to ecommerce right now, and mostly for “known” products, but it’s a starting point.
Taking Merchant Center beyond optimization
With the introduction of Performance Max and Demand Gen campaign types, it has become harder to see where your ads appear, how they perform, and which search terms & audiences these campaigns trigger. And more importantly it’s become more difficult to understand how we (the advertisers) can influence these factors.
We’ve all heard about SKUs and product feeds and how they need to be optimized, but that’s just the assumed baseline for any ecommerce store. Updating titles, descriptions, and optimizing images is critical, but it’s also just the bare minimum, not enough to expect any sort of meaningful performance effect when other advertisers are going even further.
Merchant Center is most effectively used by getting insights on which products to hold in inventory, review which promotions increase transactions, look at competitive visibility and pricing, and see user trends over time.
The Basics
The first thing that everyone needs to do once they’ve uploaded their products to the Merchant Center is to review all products (or at least a healthy sample size if you have thousands of SKUs). Make sure there is no gibberish in your descriptions, the titles are clear, the categories are set up correctly, and your GTINs are real. Our reason for this is the fact that Google Ads is going to choose which keywords you need to appear for based on this information. The more you provide, the more likely you are to appear for people that are searching exactly for what you offer. And you also get to appear for organic searches (free listings).
As an example, we had a new product that we are running Shopping ads for: “Dehydrated Rice and Beans meal”. As we first experimented, the ads were triggered by search terms from people looking to buy beans or rice online. Not really who we wanted. By updating the descriptions with terms like “perfect for backpacking and long-term storage” we quickly began appearing for “backpacking food”. You still need to make sure that your descriptions are acceptable for human eyes, as if you just cram a bunch of keywords to your descriptions, you will lose more than you win. But, it’s important to add all available information that you think makes your products easier to target.
But, this is the bare minimum, and there’s been a lot written about this. It’s not what we’re here to talk about today.
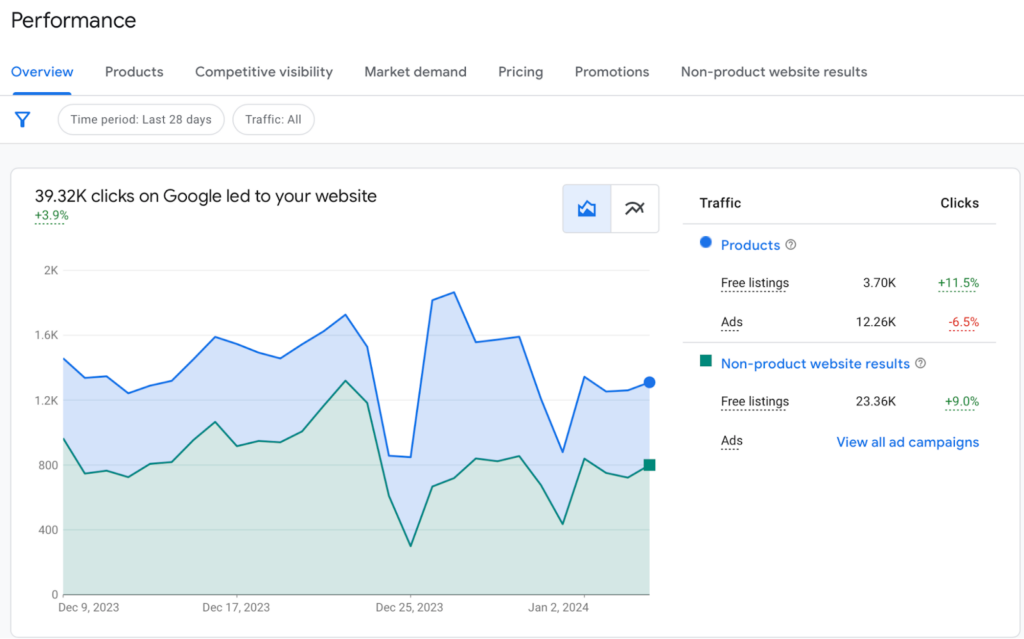
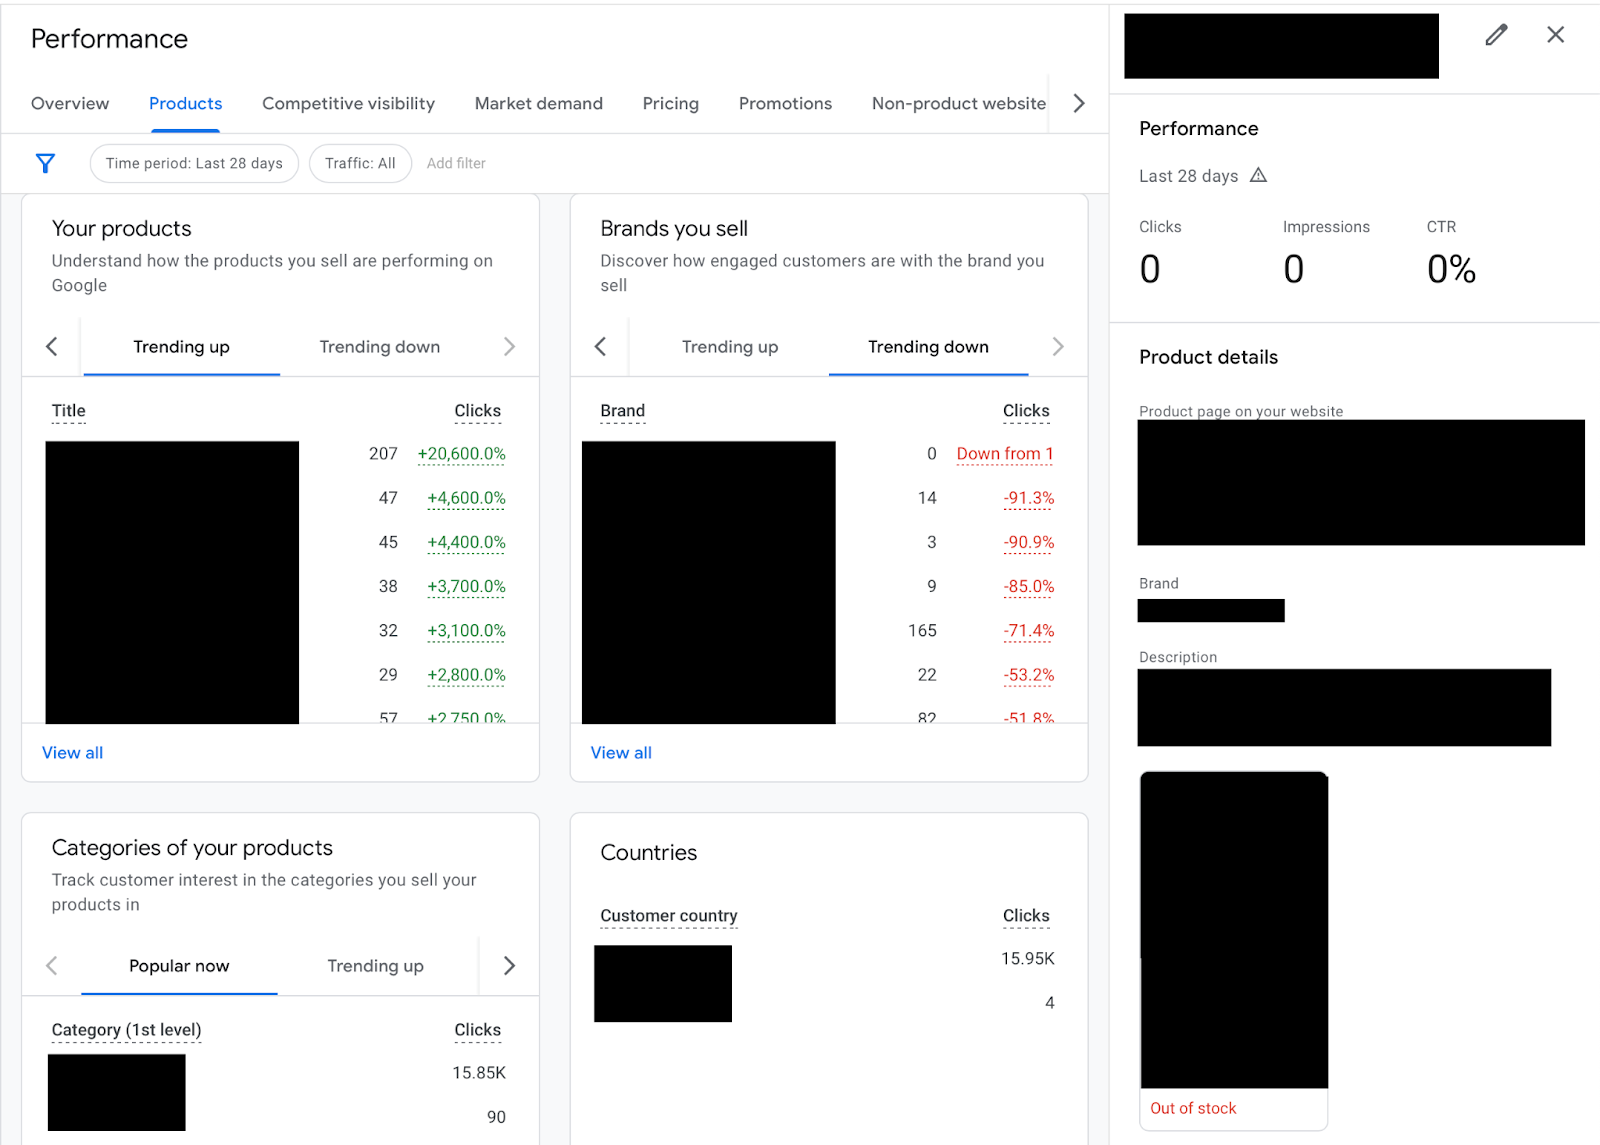
What else can we use the Merchant Center for? We’ll be going through the Performance tabs that are available in both the standard Merchant Center (Performance > Dashboard) and in Merchant Center Next (Activity > Performance). You should see something like this in the Overview section.
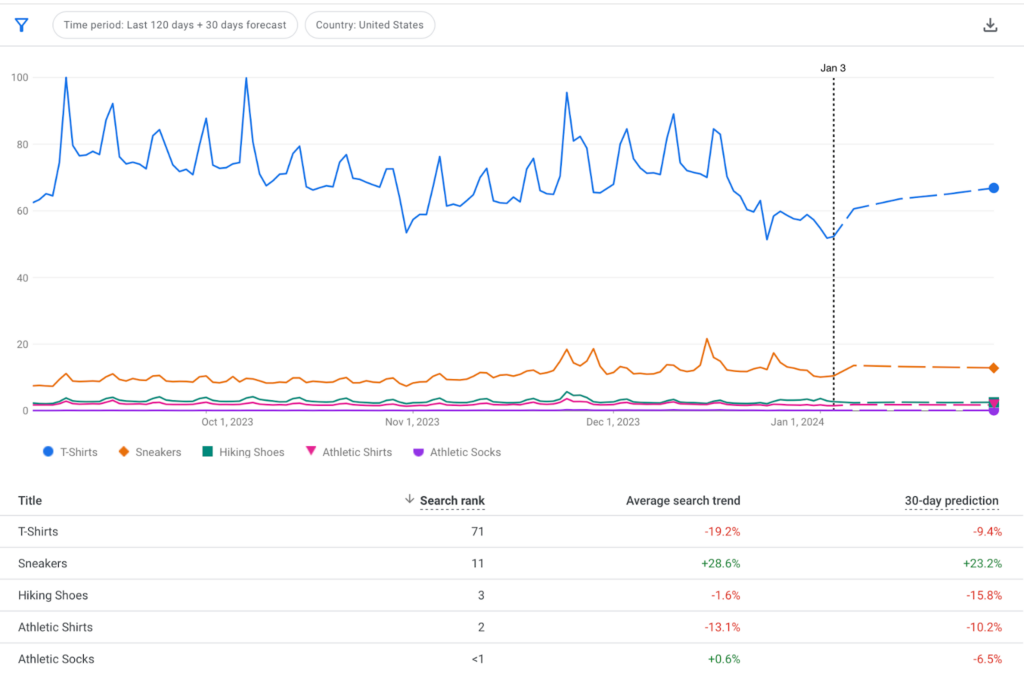
Additionally, in this Overview tab you can see trend data for your SKUs. Isn’t it interesting that every weekend there is a spike in searches for T-shirts? Use this data: what if we run a special promo for T-Shirts on weekends only? And what else can we learn about our products, trends and competition?
Market Demand
Does anyone even want what you have? (The question you should ask before you start selling things, but we digress).
We’ll start a bit out of order, focusing on the Market Demand tab, a great starting point for product demand analysis.
- You can analyze categories and discover how popular your products or brands are;
- You can look at all products in your chosen category (even those you don’t sell) and see if there is any new product lines you may want to start offering due to growing popularity;
- You can review other categories (even those you don’t have any products in) for even more product expansion outside your current niche;
- You can look at your out-of-stock products and see which ones are growing in popularity so you maintain appropriate inventory (this is a surprisingly common failing for ecommerce brands).
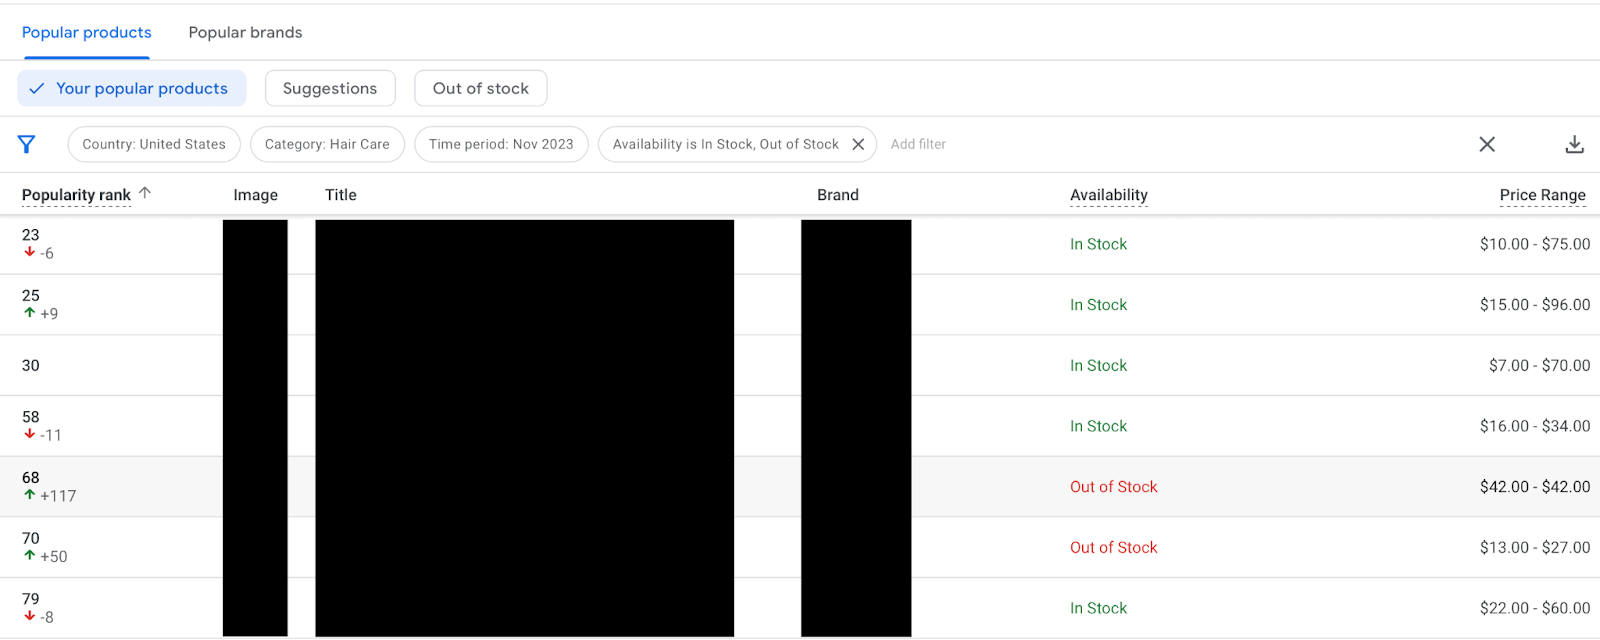
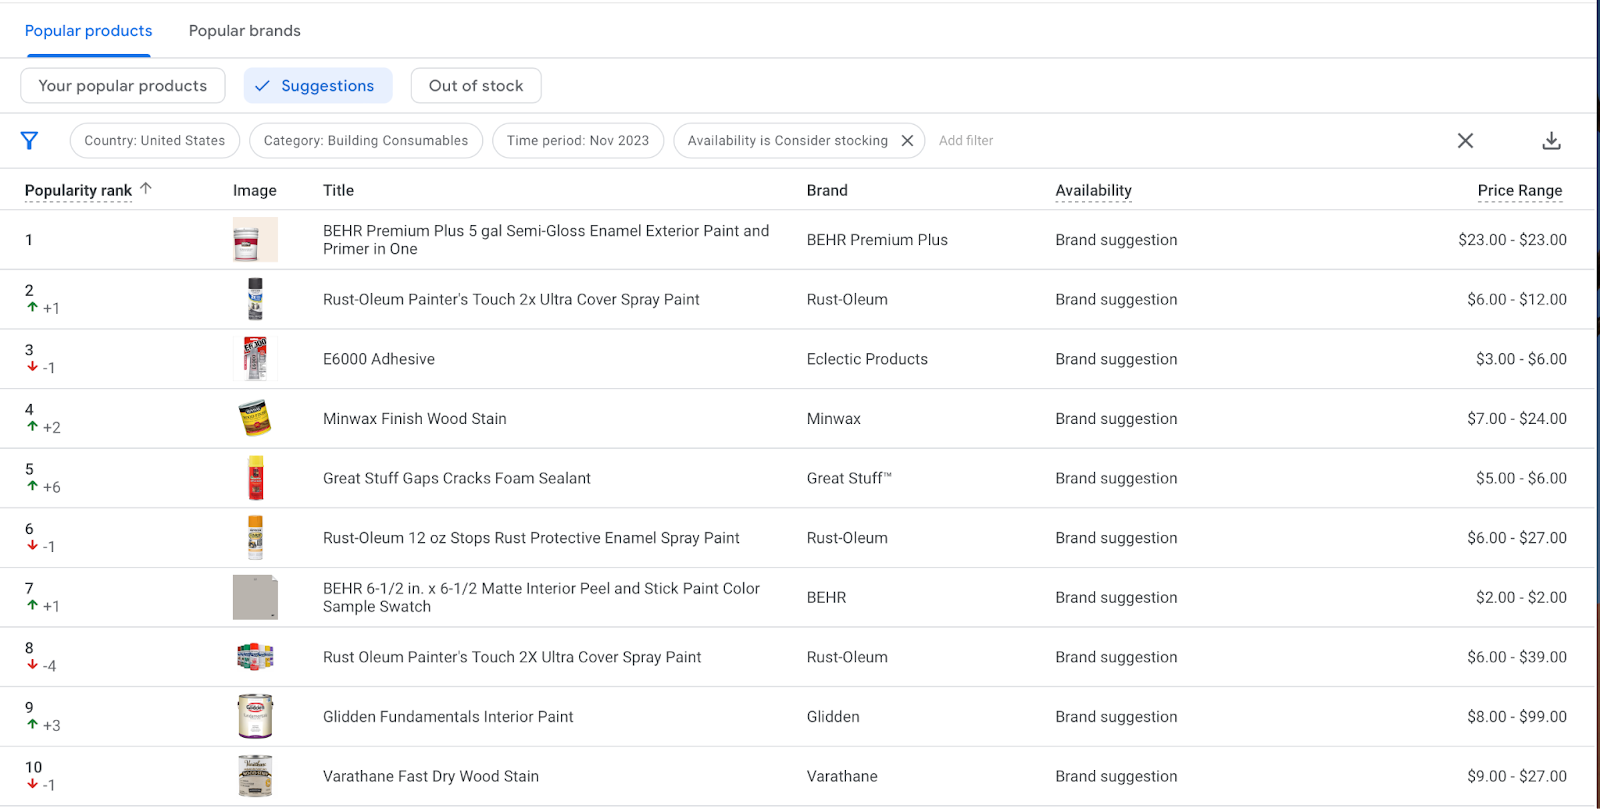
Click on Your Popular Products. This lets you see aggregated data from all stores selling the same product/brand. Google ranks your popular products based on how often customers are buying them online. It also lets you understand how accurately your product is categorized. If you click on your Google product category, you can see a list of all your products or brands and how they rank. You can analyze trends and also see which of your popular products are out of stock at a time when their popularity skyrockets.
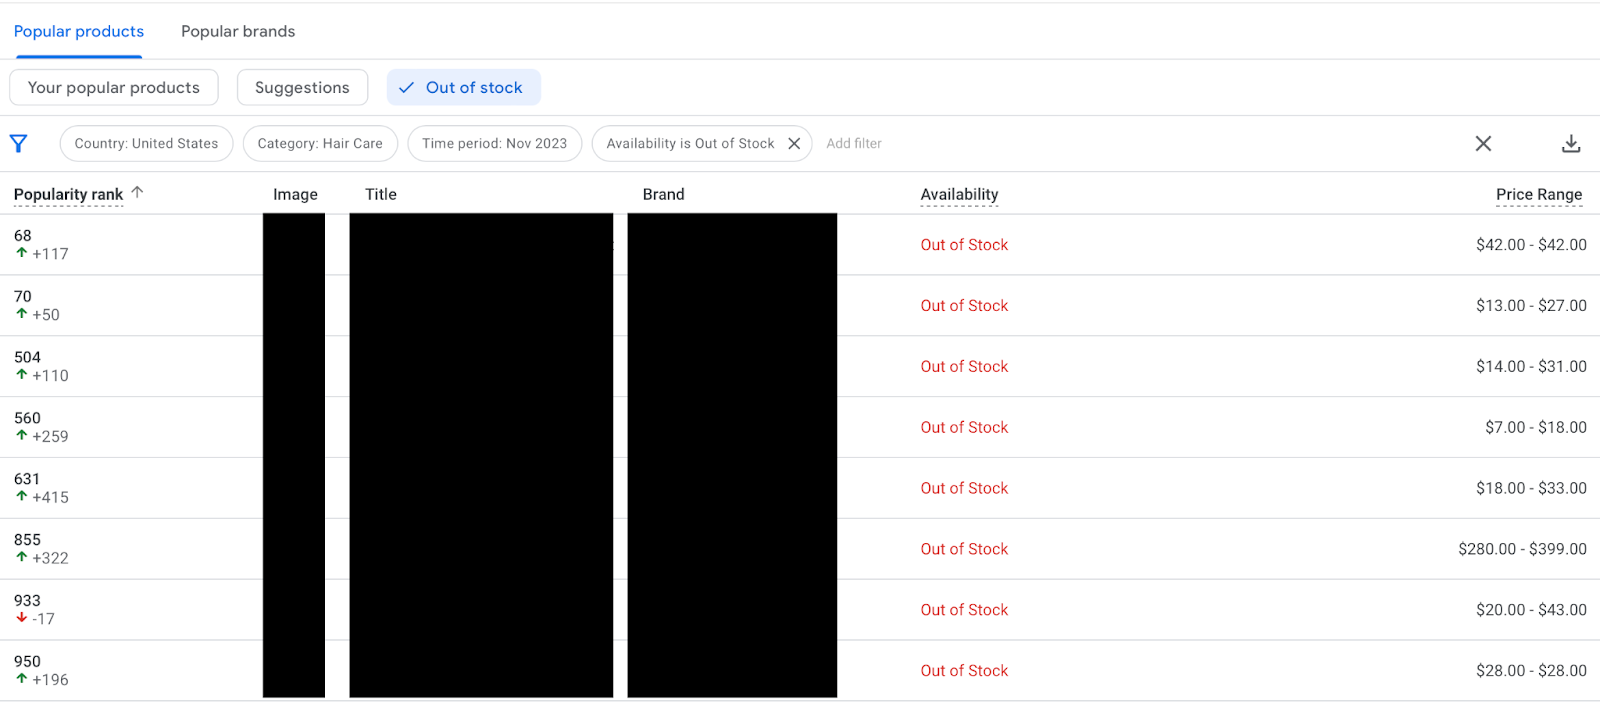
Filtering by Out-of-stock shows which of your most popular products are out of stock and gaining or losing popularity. If you have limited funds, it can help prioritize which products to invest in, and which products to reduce in your inventory.
Filter by Suggestions: Additionally, if you are trying to expand your offer (or maybe even try a new business and need product ideas) you can move to the “Suggestions” tab and see which products were the most popular on Google in any certain month. This can help understand the trends for holidays, Black Friday offers, the week after Christmas, and more. And it doesn’t have to be just the category you sell in. Maybe you want to expand towards something new: you can research and review any category that is being sold on Google Shopping. You can either choose to look at products or brands to sell.
Competitive visibility
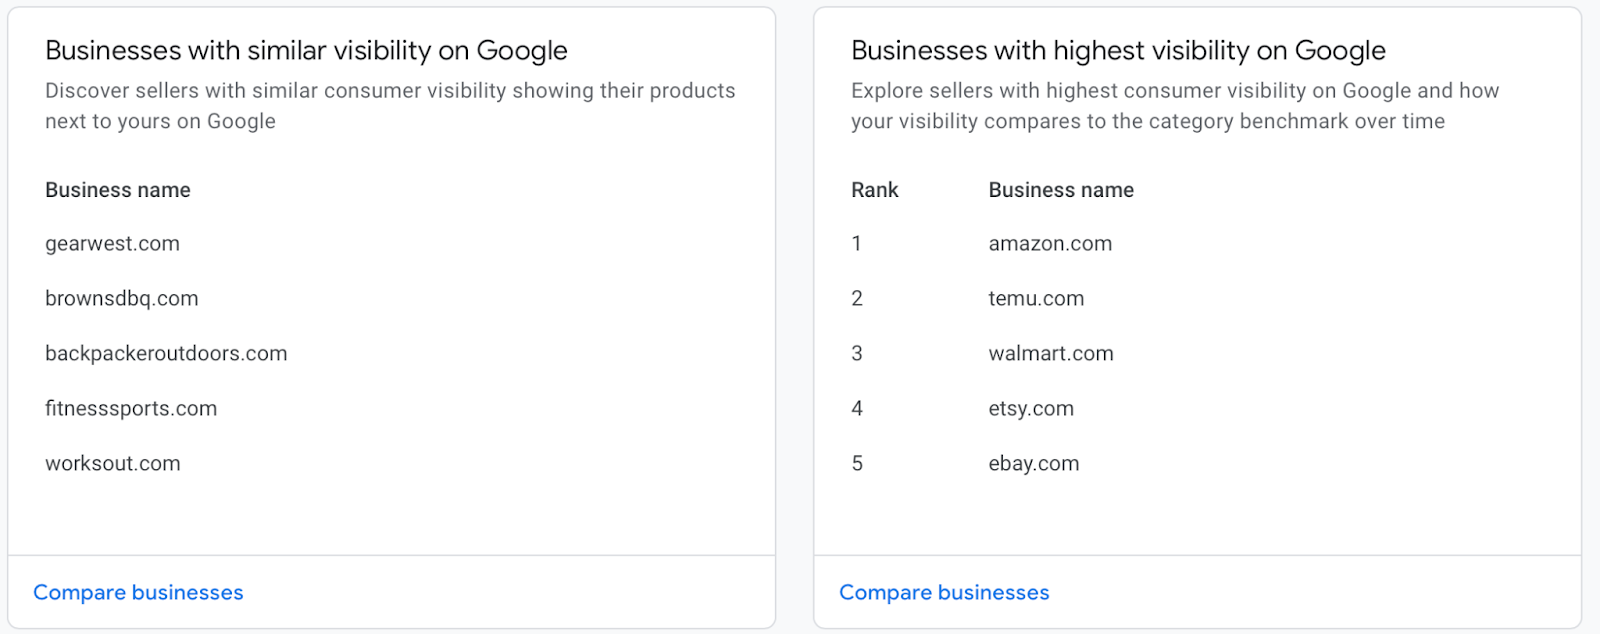
Competitive Visibility lets you research your own categories — or others that may have similar visibility and size to yours, but in a different niche. Lately, we like looking at this more than Google Ads auction insights.
This shows both the big brands that take over everything, every time (Amazon, Walmart, Target, and whatever this new thing called Temu is) and also the smaller guys.
Assuming that you aren’t the media buyer for Temu who’s reading this, the smaller guys are “businesses with similar visibility on Google”. They are likely more of a direct competitor in both offerings and size. Those are the brands that appear close to your name the most.
You can do some really detailed competitor research here.
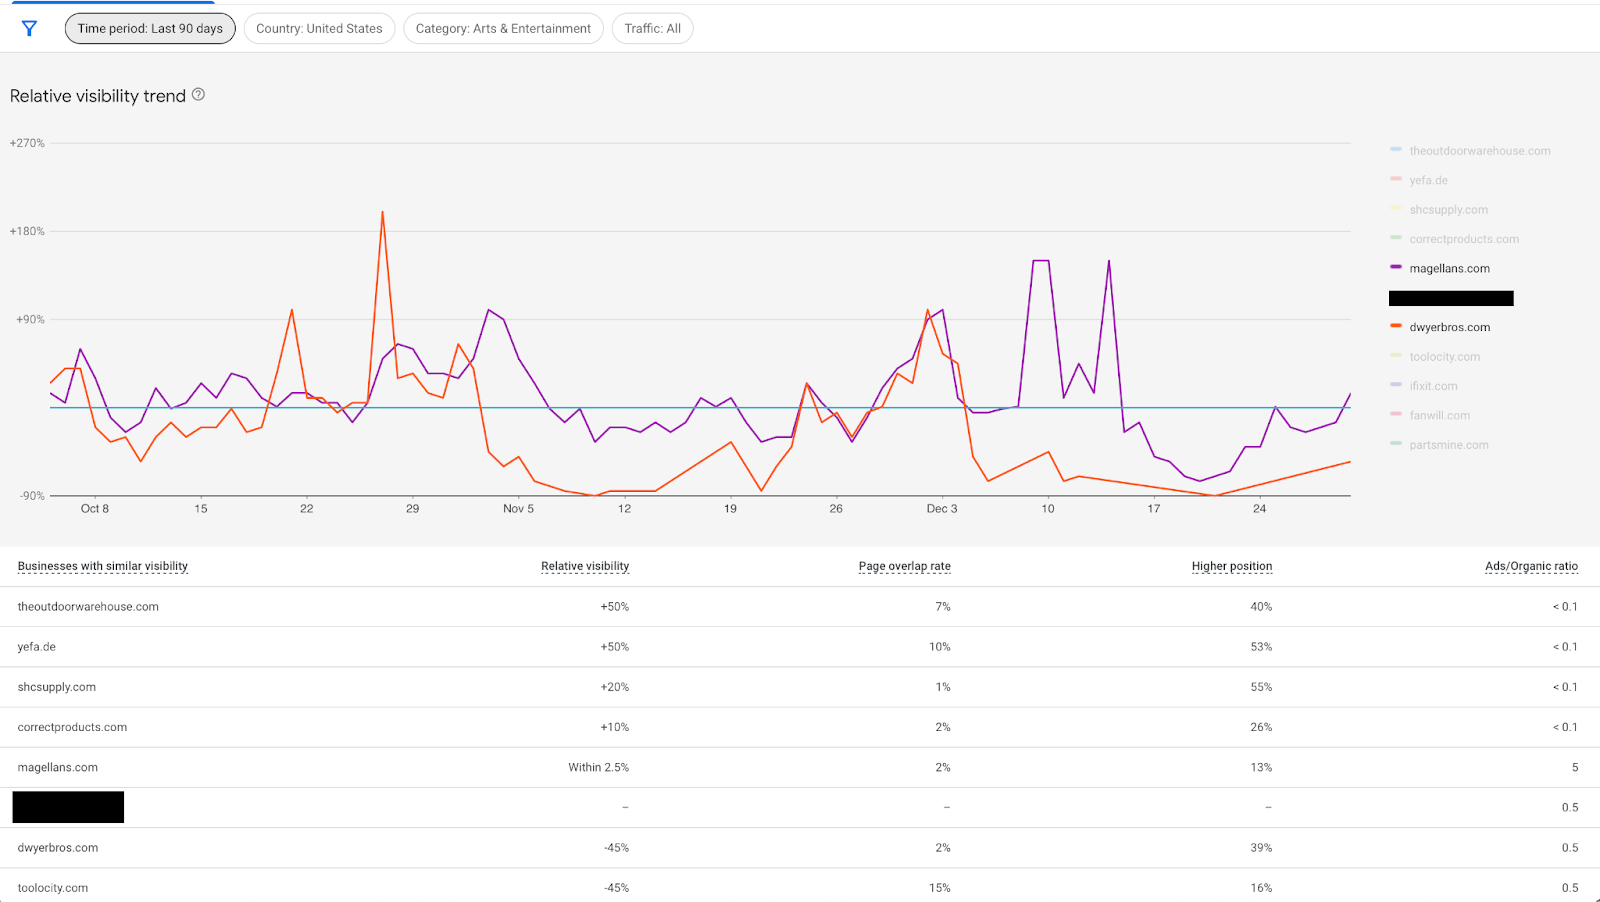
Below, the Ads/Organic ratio is an interesting metric for us to look at. It shows the ratio of ads and organic impressions for a merchant. For example, if a merchant has 10 times more ad impressions than organic impressions, the Ads/Organic ratio is 10.
In the example below, we are looking at a category that our client is not currently selling in. We are helping them research a new niche and see who the actual competition is. Our page overlap rate metrics are very low. Due to a low Ads/Organic ratio, most of those websites are not running Shopping ads, so if we decided to choose to add products to those categories there may be relatively little paid competition.
Products
Here, you can analyze your products and see how popular they are as an organic listing. The more products you sell, the more useful information you can find here. If you ever wondered how much you sell via free listings on Google, this is the place to go. Compare how much of it is paid vs organic.
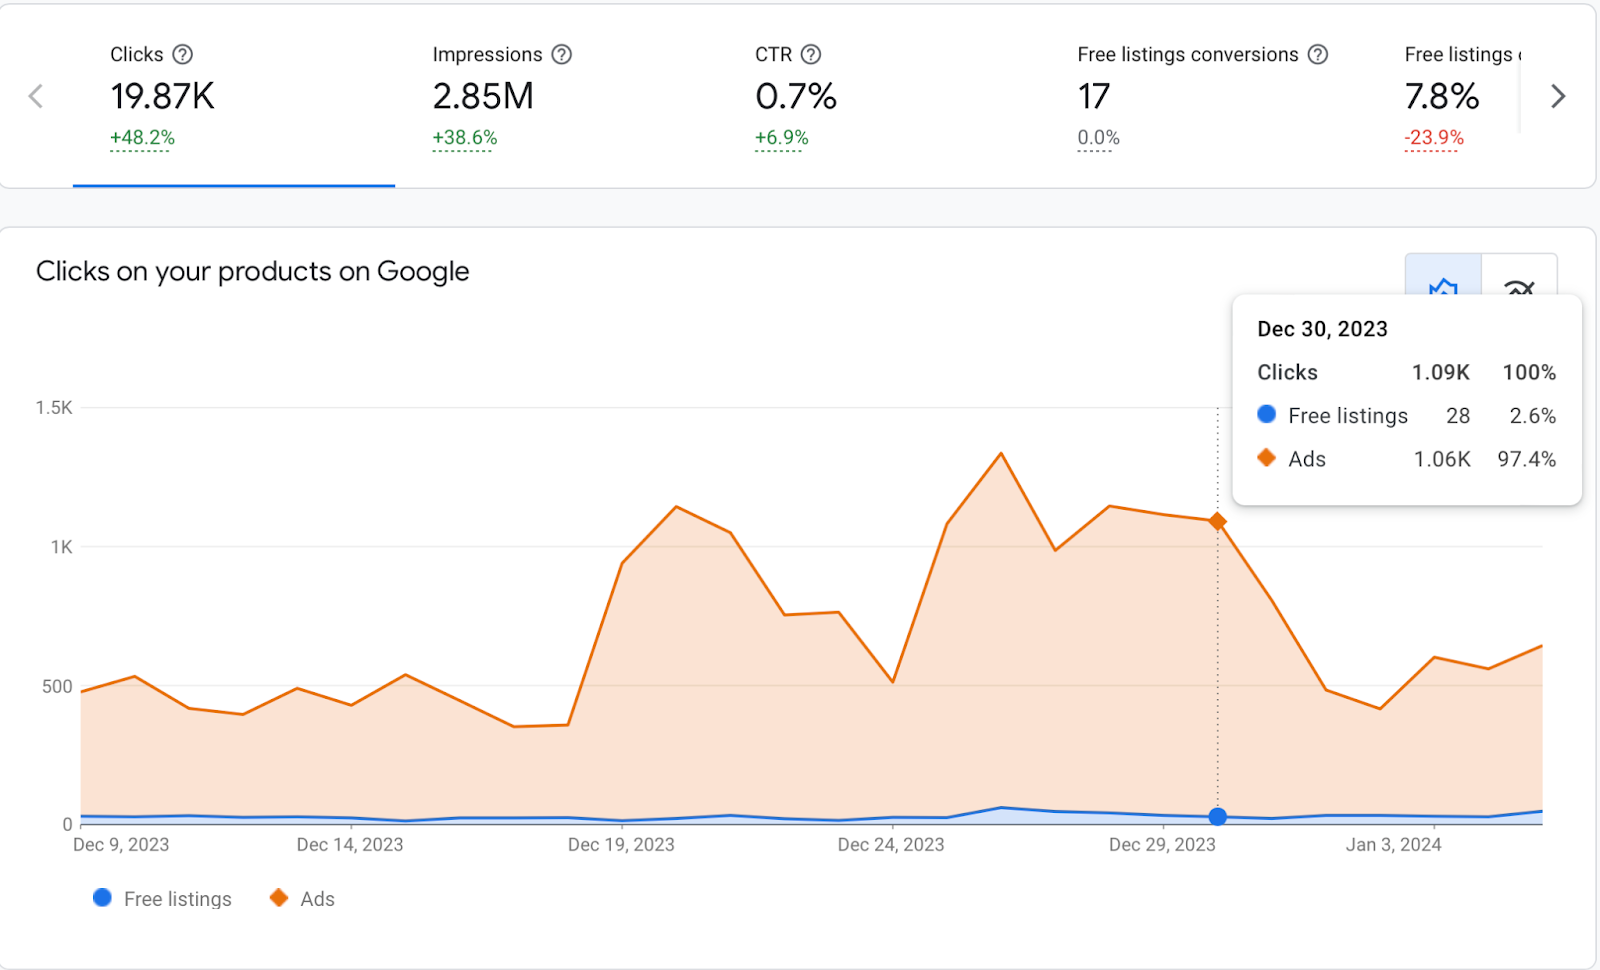
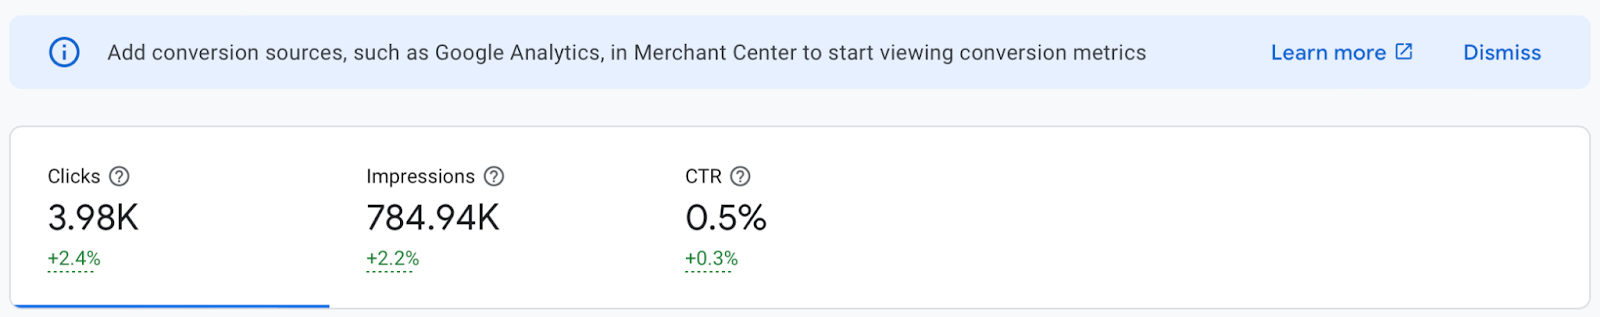
If you only see clicks and impressions, make sure you have connected Google Analytics to Merchant Center to see sales data, otherwise it will look like this:
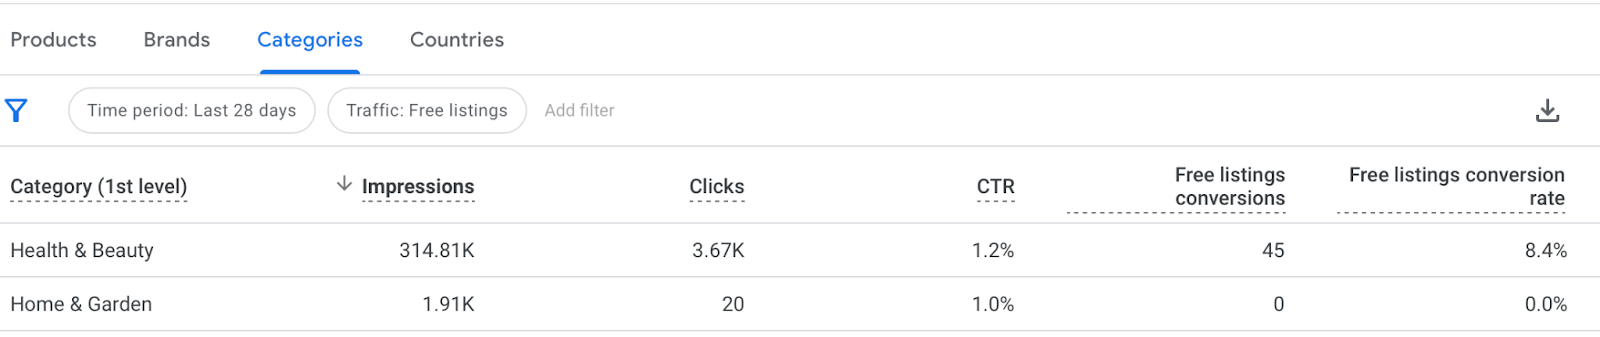
Analyze the data further and open any tables that appear below this, and click “View all”. Here you can choose to see only “Free Listing” numbers by product, brand, country and category.
Additionally, you can see which products are trending up and down. Review and edit them immediately if needed (they may be trending down because they are just out-of-stock).
Pricing
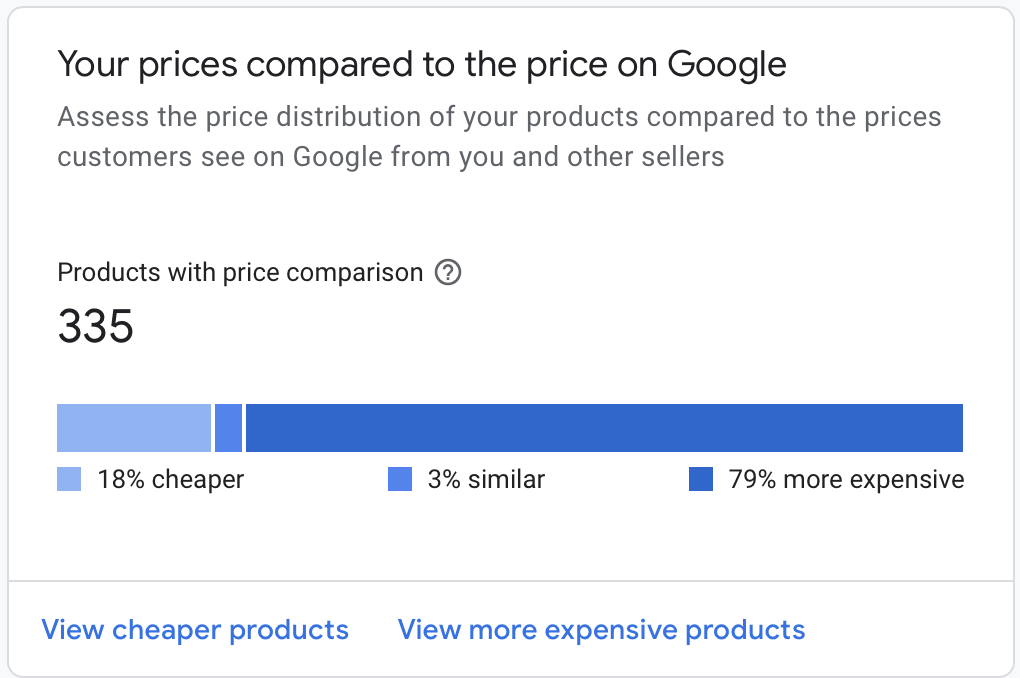
One of the most important tabs! How is your price vs competition?
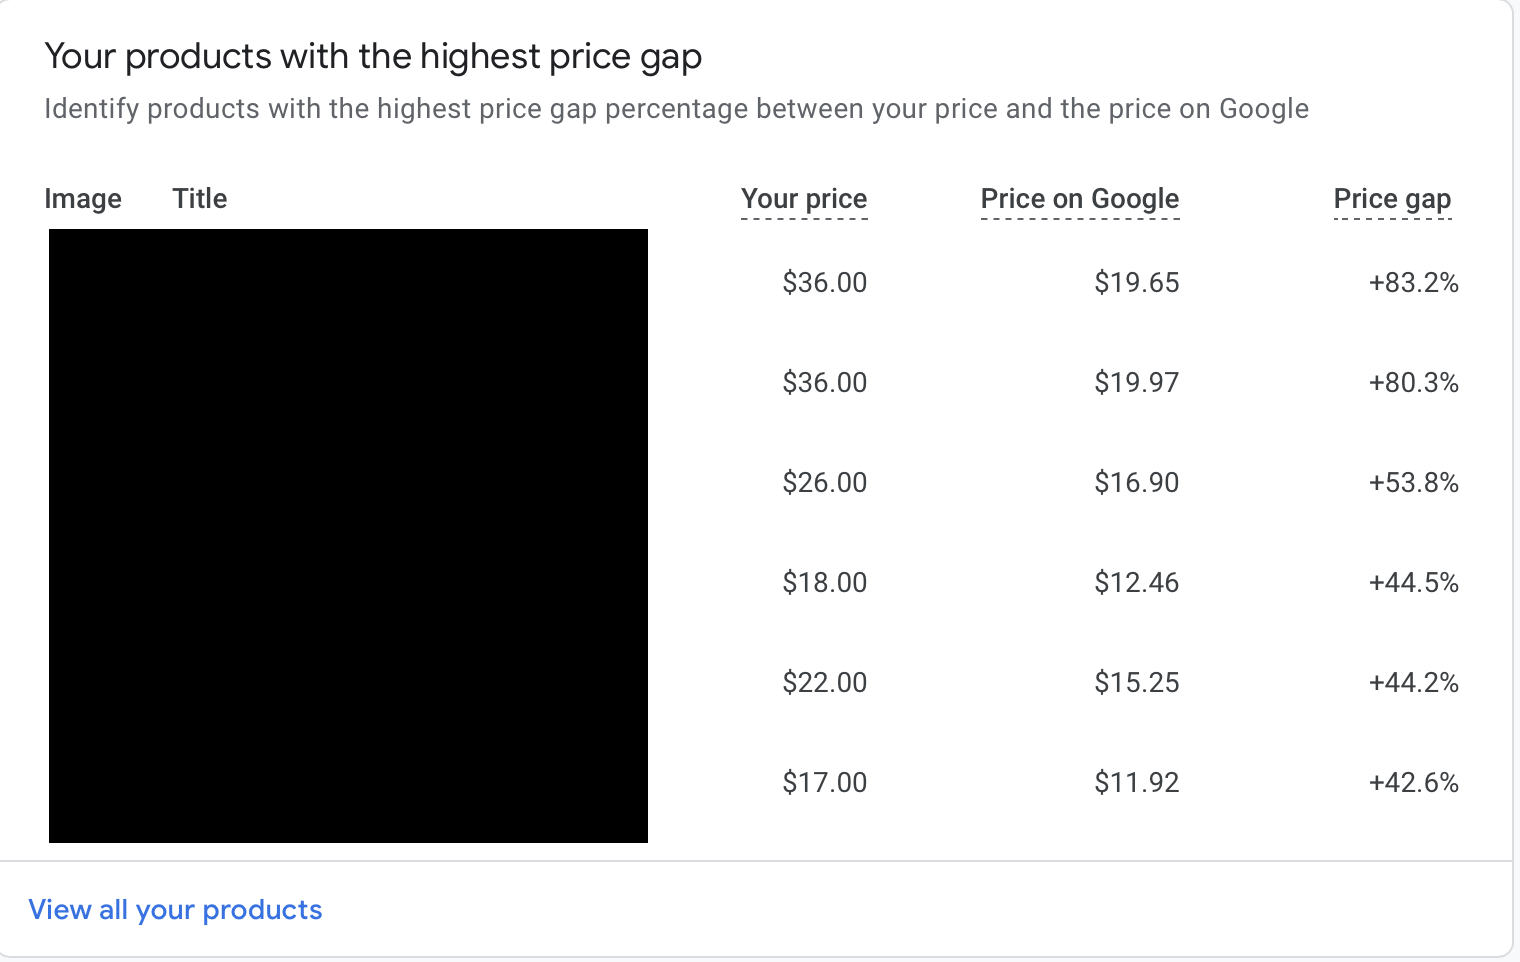
Look at the prices with the highest gap. Why is yours more expensive? Open the competitor website (find these via the Competitive Visibility tab) and see what they are offering that you are not. Is it a temporary sale, or a permanent lower price? If it’s permanent, how can they afford to sell it cheaper? (Worth discovering if you can do that too!) If you don’t want to advertise your product for a lower price for everyone, can you test a special offer/promotion just for Shopping ads? See how this will affect your margins and sales.
But also, make sure you don’t “fake” a sale. If the sale price is the same on your website as the normal price is on competitor’s websites, you will lose trust.
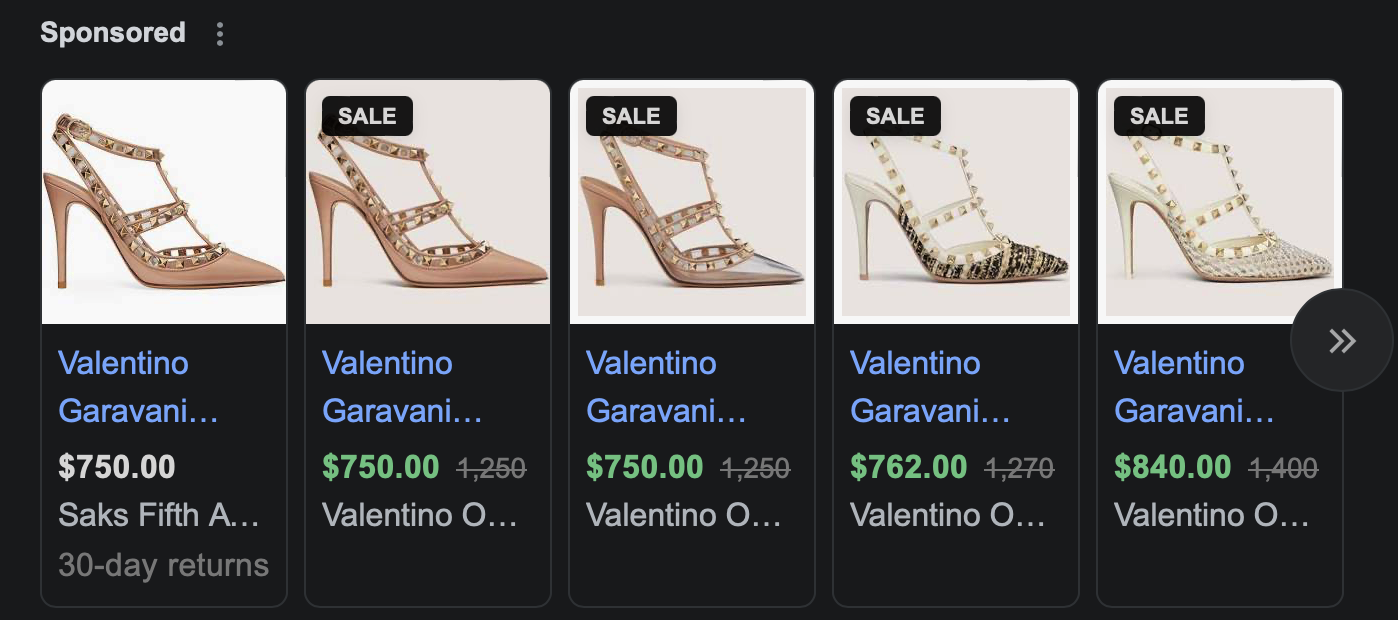
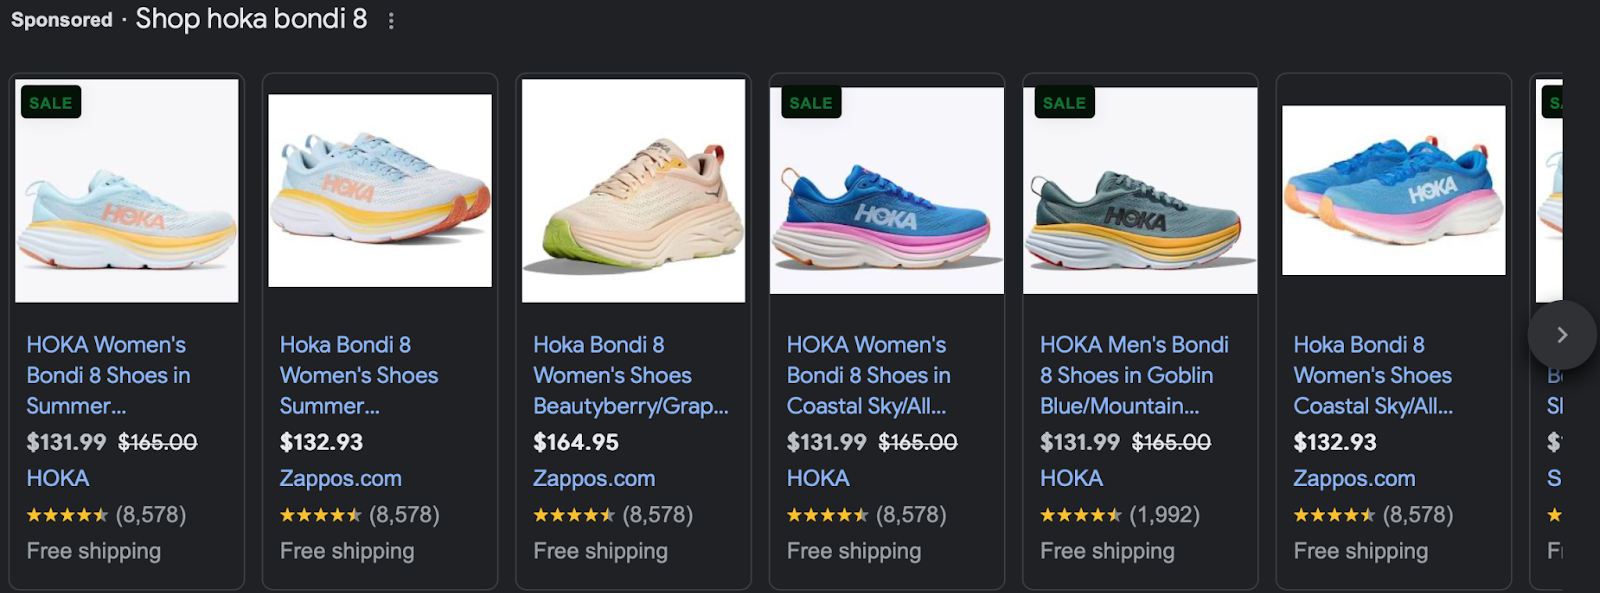
Here is a good example. At Saks, you can buy this shoe for $750. Or you can get it “on sale” for $750. Which do you trust: Saks, or some random outlet?
Do we believe that the HOKA Bondi 8 is actually on sale on their website, or is the Zappos price the real one?
If you’ve been seeing a decline in sales, one of the first things that advertisers assume is that the website needs to be optimized, or the ads are not set up correctly. Of course these are possible factors, but price competitiveness is always critical to check.
Look at the largest price gaps. If you think that your competitors actually can afford to sell the products so much cheaper…maybe you shouldn’t sell them. Or, maybe the competitor is not actually a competitor and is a new website that is willing to lose money to gain visibility (Temu?) then you may want to wait for a few weeks, and see if the gap changes once they cannot support a high ad spend anymore.
We have clients that look at this data on a weekly basis, constantly comparing their offers with main competitors, and adjust the prices accordingly (if the margin permits). Pretty quickly, they see an uptick in sales for the brands they just updated. If you have an ecommerce website, it is critical to remember that people will be able to compare the pricing for the same SKU right away. They base their decision most often on price, credibility of the website, and the ease and speed of shipping.
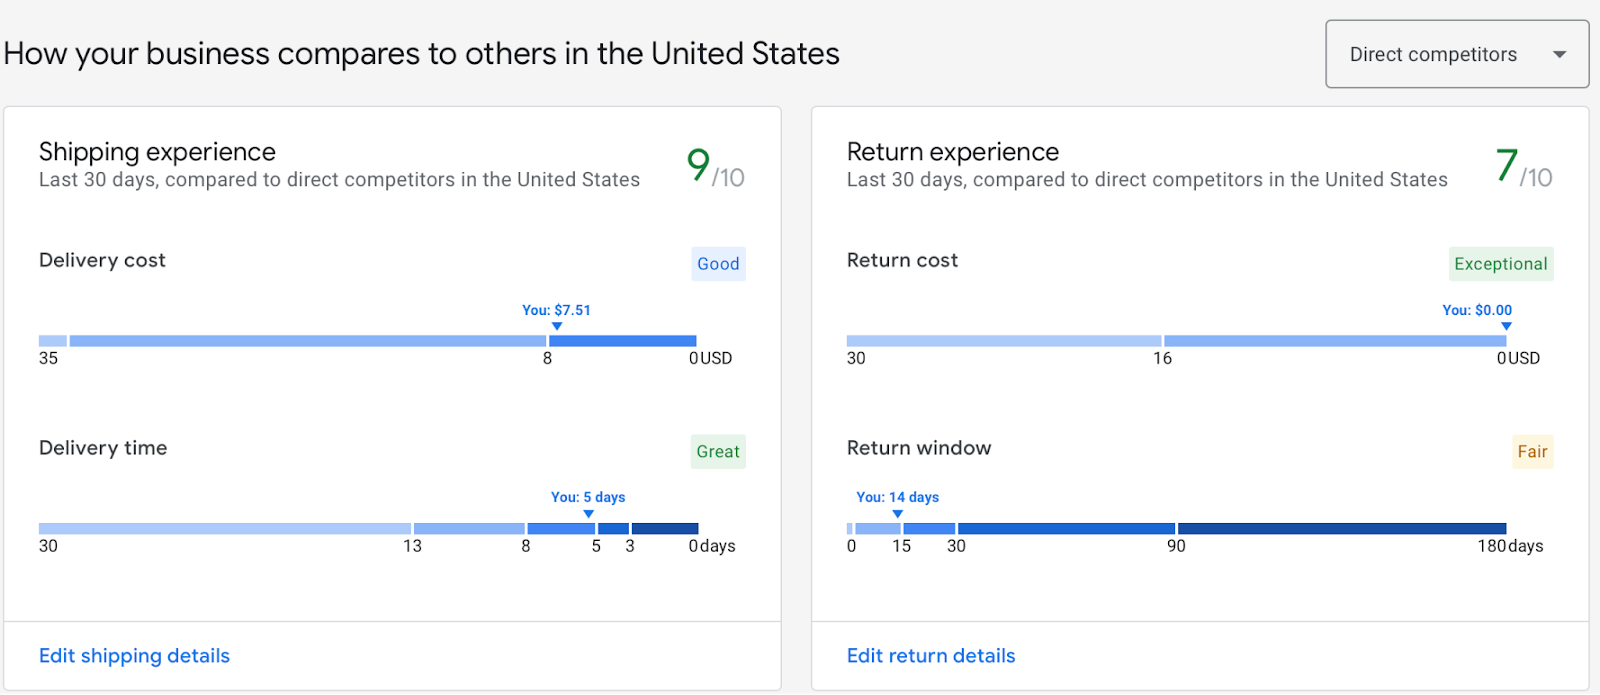
To see how your shipping experience compares to others, you may look at the Growth tab > Shipping experience scorecard and if your numbers look like this, you are doing great!
Promotions
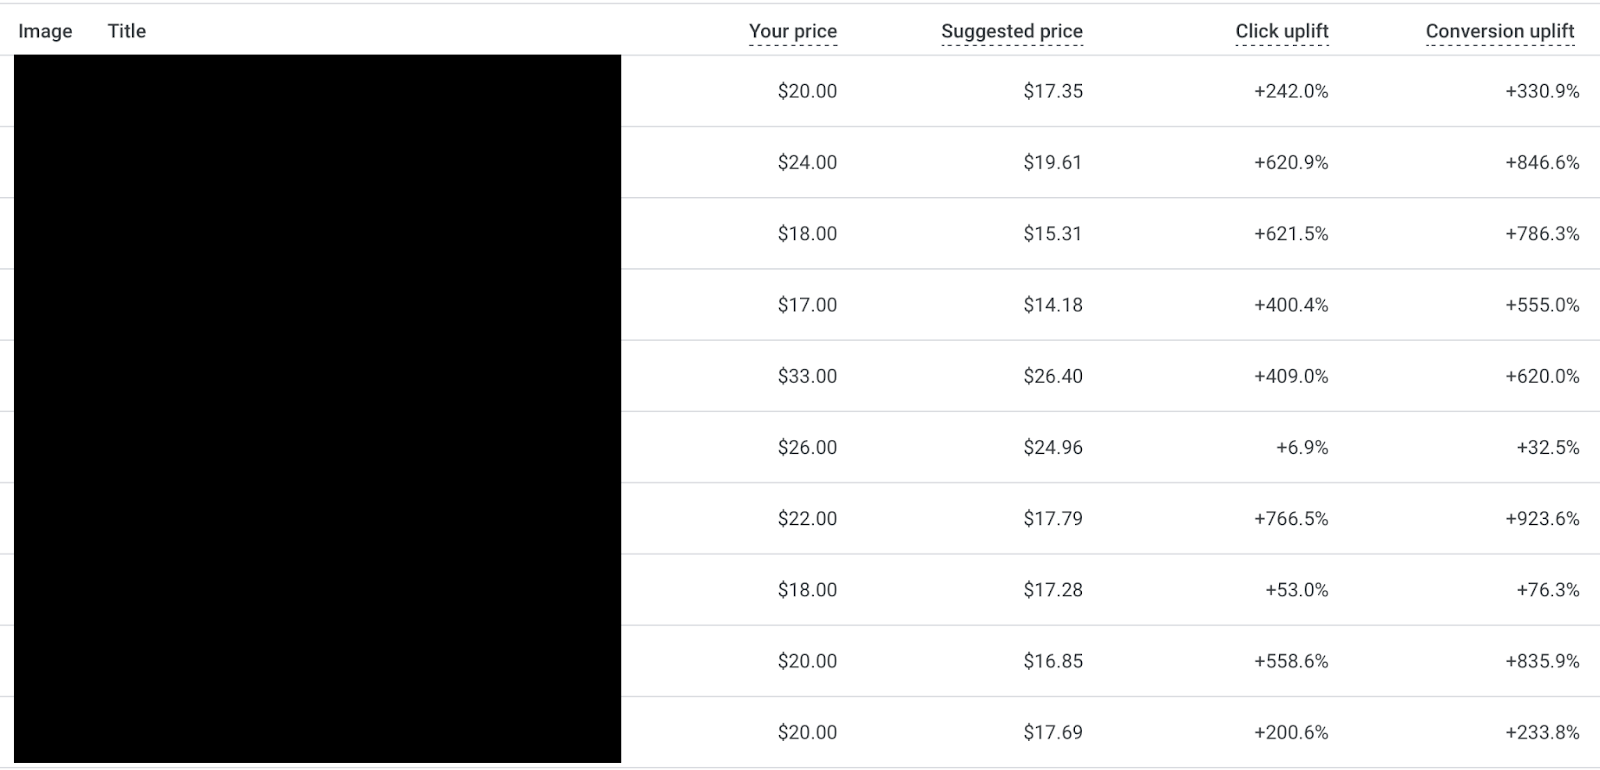
And last but not least, as we said before, a great tactic is to add promotions that will only appear on your Shopping ads, with the nice “Sale” label on top. This works great if you want to see how sales will influence performance.
Maybe you are not ready to offer a low price to everyone due to margins/profitability, but you want to increase the conversion rate for your ads. Adding a promotion via the Merchant Center allows you to test it on specific products and gain pretty rapid data on performance.
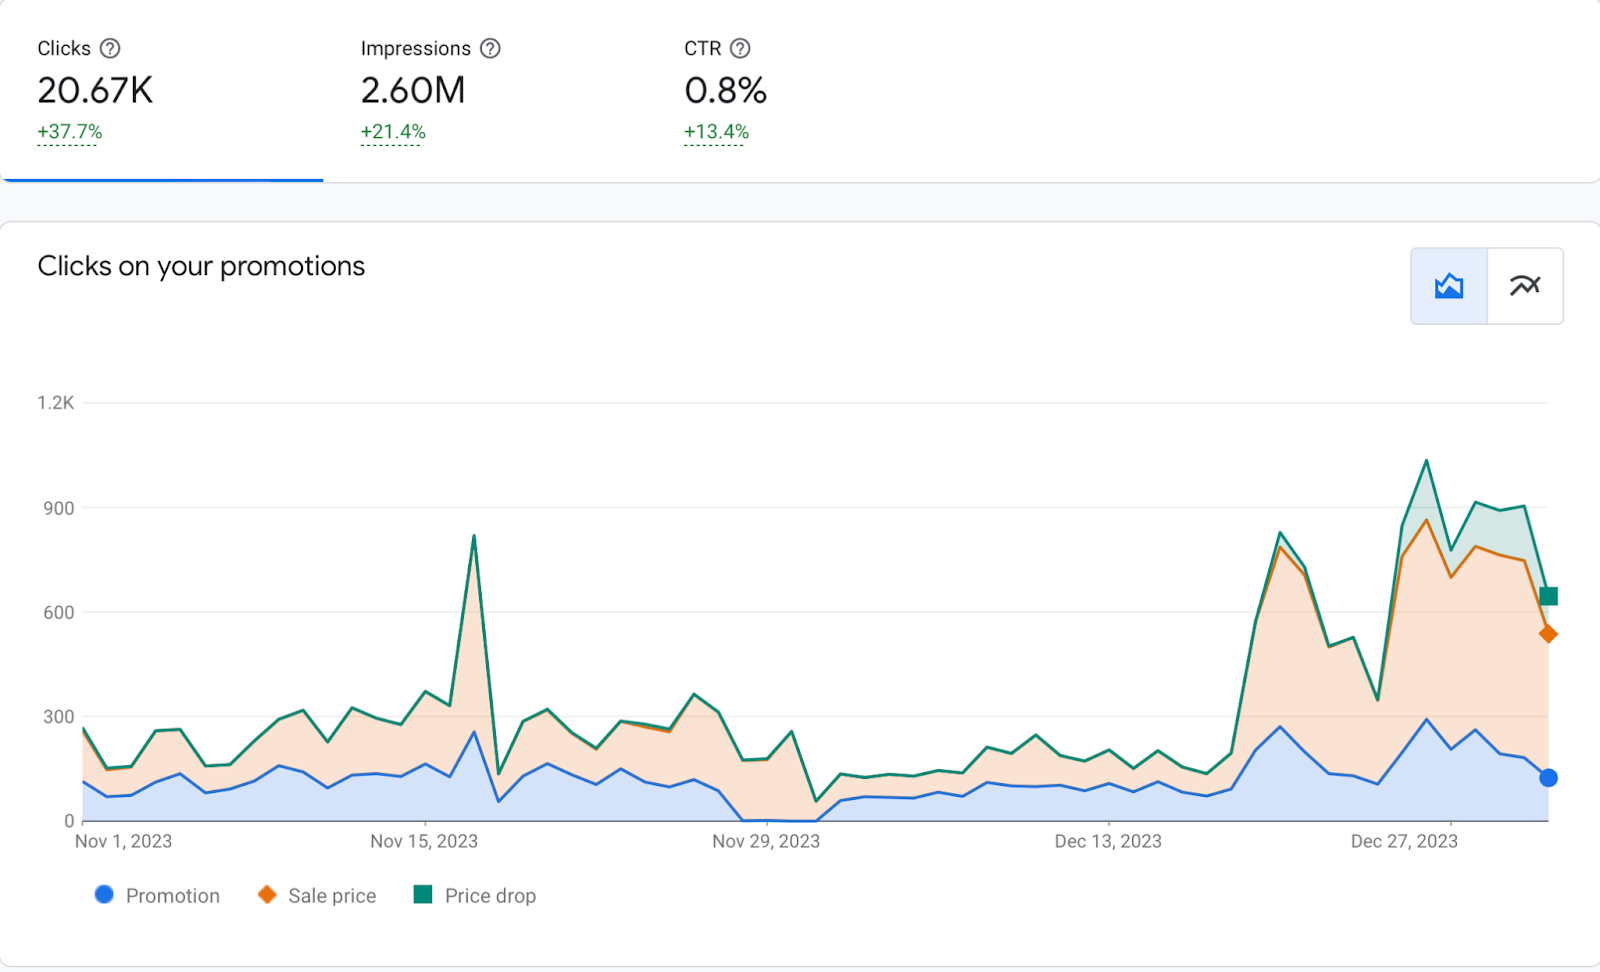
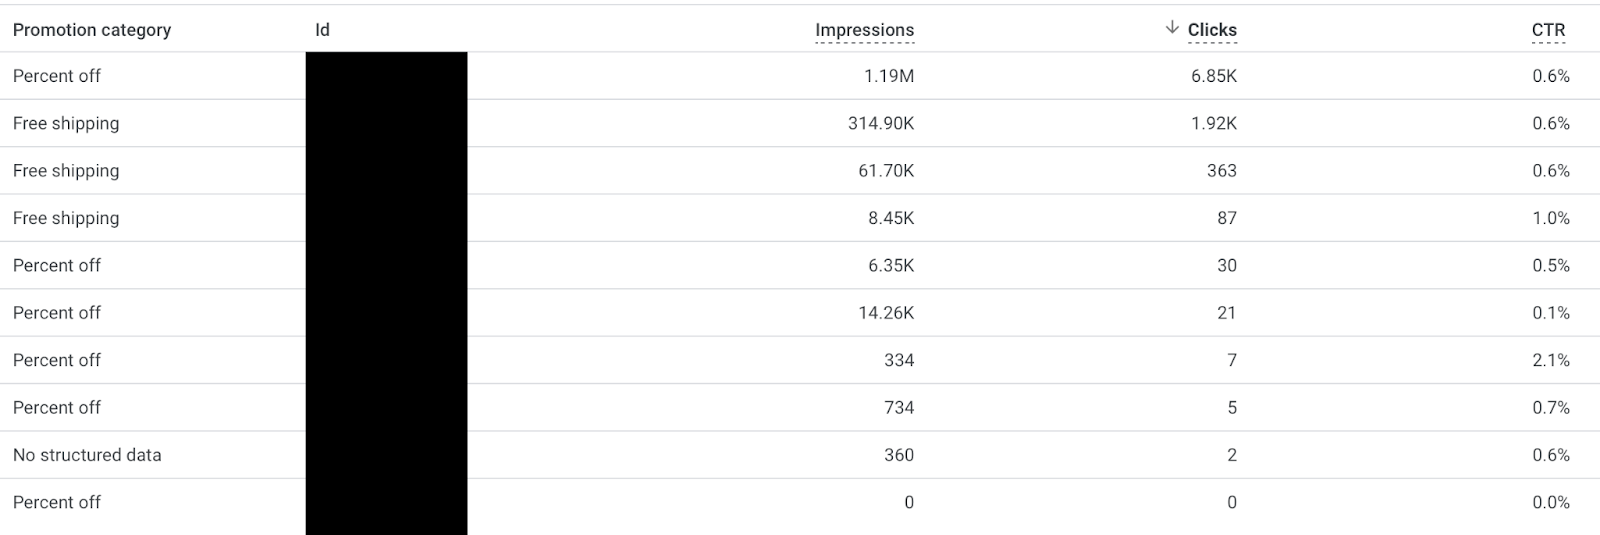
Not sure which promotion to use for next year’s Black Friday season? Analyze what worked best this year.
Enjoy? Agree? Disagree? Leave a comment, or bother Gil on X/Twitter with any of your questions!
Leave a Reply